Regional NSW areas lead growth in The Driven’s EV analysis
The Driven’s 18 September 2026 analysis of New South Wales LGA registrations says regional areas were generating the strongest BEV growth within that state, led by Kempsey.
Automatically researched, written and checked using AI. Verify details against the sources.
Verified event
The Driven published a 18 September 2026 analysis of battery-electric vehicle registrations in New South Wales LGAs, drawing on Transport for NSW Registration Snapshot data. The piece is a data analysis rather than a policy announcement or vehicle launch, and its core finding is confined to the NSW market covered by that dataset. 1
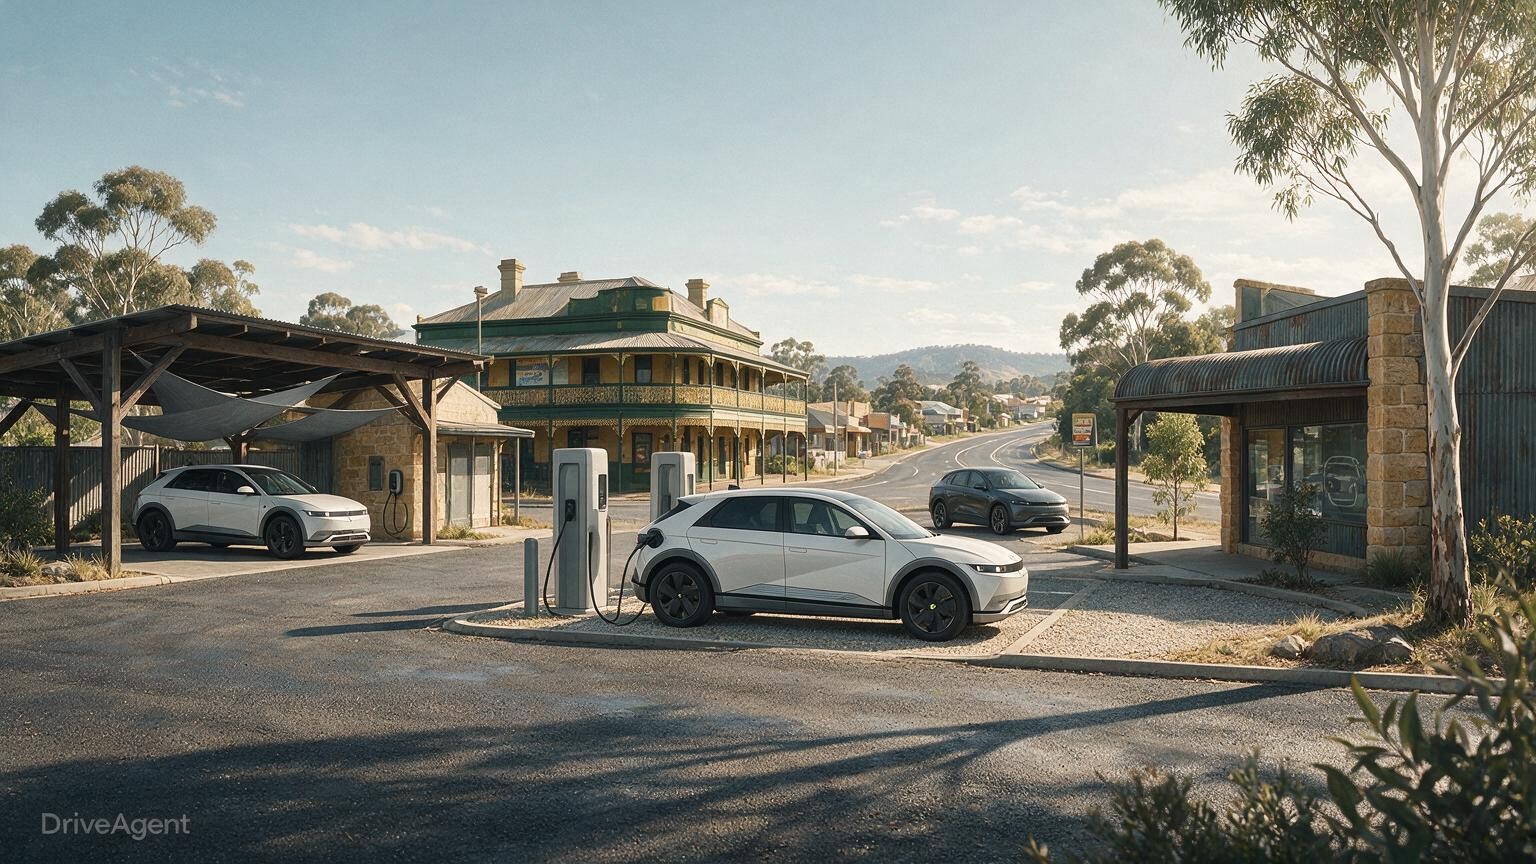
Within that analysis, Kempsey was identified as the strongest growth area, with BEV numbers up 110% from a low base. The article also said only two of the top 10 LGAs were in metro Sydney, with the remaining high-growth areas spread through regional NSW. 1
What the reported pattern shows
The same report highlighted Shellharbour, where BEV fleet share reportedly rose from 1% to 1.6% in six months, and named Maitland and Cessnock as other LGAs with growth of more than 60%. It also said the fastest-growing regions were north-eastern NSW, the Hunter and Upper Hunter, and the Illawarra and South Coast, while the Riverina and Murray showed pockets of high percentage growth but low raw volumes. 1
For Australian readers, the relevance is that the article adds another location-based layer to a broader EV uptake trend already visible in other reporting and historical state data. But the supplied material does not provide a current official national dataset that confirms the September 2026 rankings beyond the NSW analysis, and it does not establish a national metro-versus-regional comparison. 1112
Our take
In our view, the main significance lies in how the NSW numbers shift the conversation from a simple capital-city story to a more mixed map of EV adoption. One possible implication is that growth is becoming more geographically dispersed within the state, but the evidence here supports only that NSW-specific pattern, not a nationwide conclusion. 11112
In our view, the article is best read as a snapshot of where BEV registrations were growing fastest in NSW, not as proof of a settled market structure. That means local price, timing, availability and any practical impact on Australian buyers or dealers have not been confirmed in the material provided. 112
AI evidence finder
Ask about this article
Ask a question to find relevant published passages and source links. AI selects evidence; the passages remain exactly as published.
Behind this report
Sources & context
Cited source mix
3 cited pages across 3 websites
- Role not assessed 3
Website breakdown
- carsguide.com.au1 page
- dtf.vic.gov.au1 page
- thedriven.io1 page
3 cited pages with an undocumented publisher role. Websites may share ownership or repeat the same reporting.
Saved research extracts
0 / 3 cited pages with saved extracts
0 shortened at our text limit · 3 without a saved-extract record
Extracts can omit page content. These counts do not verify claims or measure independent reporting. Political leaning and reliability are not rated.
- Six months into the war, regional areas are leading ...Role not assessedExtract not recorded
Why these labels?Six months into the war, regional areas are leading ...
Who produced it
We have not documented this publisher’s role. An unassigned label is not a negative rating.
How this report uses it
Cited in 5 paragraphs: Verified event; What the reported pattern shows; Our take.
This describes its use in our report. It does not establish the source’s editorial stance or independently corroborate every claim.
Evidence record
No retained-text metadata is attached to this source. Its access date alone does not establish that the complete page was read.
- 4. DataRole not assessedExtract not recorded
Why these labels?4. Data
Who produced it
We have not documented this publisher’s role. An unassigned label is not a negative rating.
How this report uses it
Cited in 2 paragraphs: What the reported pattern shows; Our take.
This describes its use in our report. It does not establish the source’s editorial stance or independently corroborate every claim.
Evidence record
No retained-text metadata is attached to this source. Its access date alone does not establish that the complete page was read.
- New data shows where electric car uptake is the highest in Australia as Tesla, BYD and Zeekr surge in sales chartsRole not assessedExtract not recorded
Why these labels?New data shows where electric car uptake is the highest in Australia as Tesla, BYD and Zeekr surge in sales charts
Who produced it
We have not documented this publisher’s role. An unassigned label is not a negative rating.
How this report uses it
Cited in 3 paragraphs: What the reported pattern shows; Our take.
This describes its use in our report. It does not establish the source’s editorial stance or independently corroborate every claim.
Evidence record
No retained-text metadata is attached to this source. Its access date alone does not establish that the complete page was read.
Other collected links (12)
These links were collected during research but are not cited in this article or counted above. Listing a link does not establish that it was read, relevant or used to support this report.
- Home ↗
- Australia's EV sales surge 91% year-on-year, says EVC ↗
- Tesla posts another near record sales month in August, pointing to "structural shift" in Australia's EV market ↗
- Autonomous Vehicles Archives ↗
- Which are the most EV friendly capital cities in Australia ... ↗
- Mar26 reply - Electricity Supply for Electric Vehicles ↗
- Australia August 2026: BEVs up 169.4% to outsell petrol at record ... ↗
- Regional EV Sales Surge in Queensland to 48% ↗
- WA electric vehicle licensing data ↗
- Surge in electric car sales puts added strain on Australia's stretched EV charging network ↗
- Electric Vehicle Index ↗
- World EV Day: Australia hits half a million battery electric ... ↗
Keep reading
Related subjects and more from this section.
Established brands match Chinese rivals in Australia search growth
AutoTalk’s latest Australian market report says online search growth for established marques has kept pace with Chinese rivals, even as Chinese brands continue to climb the sales rankings.